- Home »
- Insights »
- CIO View »
- Chart of the Week »
- Cryptic messages

On Monday, Dec. 4th, the Bitcoin price once again exceeded the technically important mark of USD 42,000 for the first time in 19 months. Since the beginning of the year, Bitcoin's price has risen by around 150%. In addition to the usual suspects such as falling interest rate expectations, which have recently boosted various asset classes, crypto-specific factors are also playing a role. For example, on-chain activities demonstrate increasing adoption. Also, market participants increasingly expect the U.S. Securities and Exchange Commission (SEC) to approve Bitcoin spot ETFs fairly soon.[1]
This raises the question as to what extent cryptocurrencies can complement a traditional portfolio.[2] An important measure for the diversification potential of an alternative asset class is its correlation with traditional asset classes such as equities or bonds. As correlation calculations are based on historic price data, their predictive power is limited – especially for nascent and very dynamic asset classes such as cryptocurrencies. Nonetheless, looking at historic correlations can provide a useful initial indication.

Different ways of looking at Bitcoin versus the S&P 500 suggest a nuanced picture
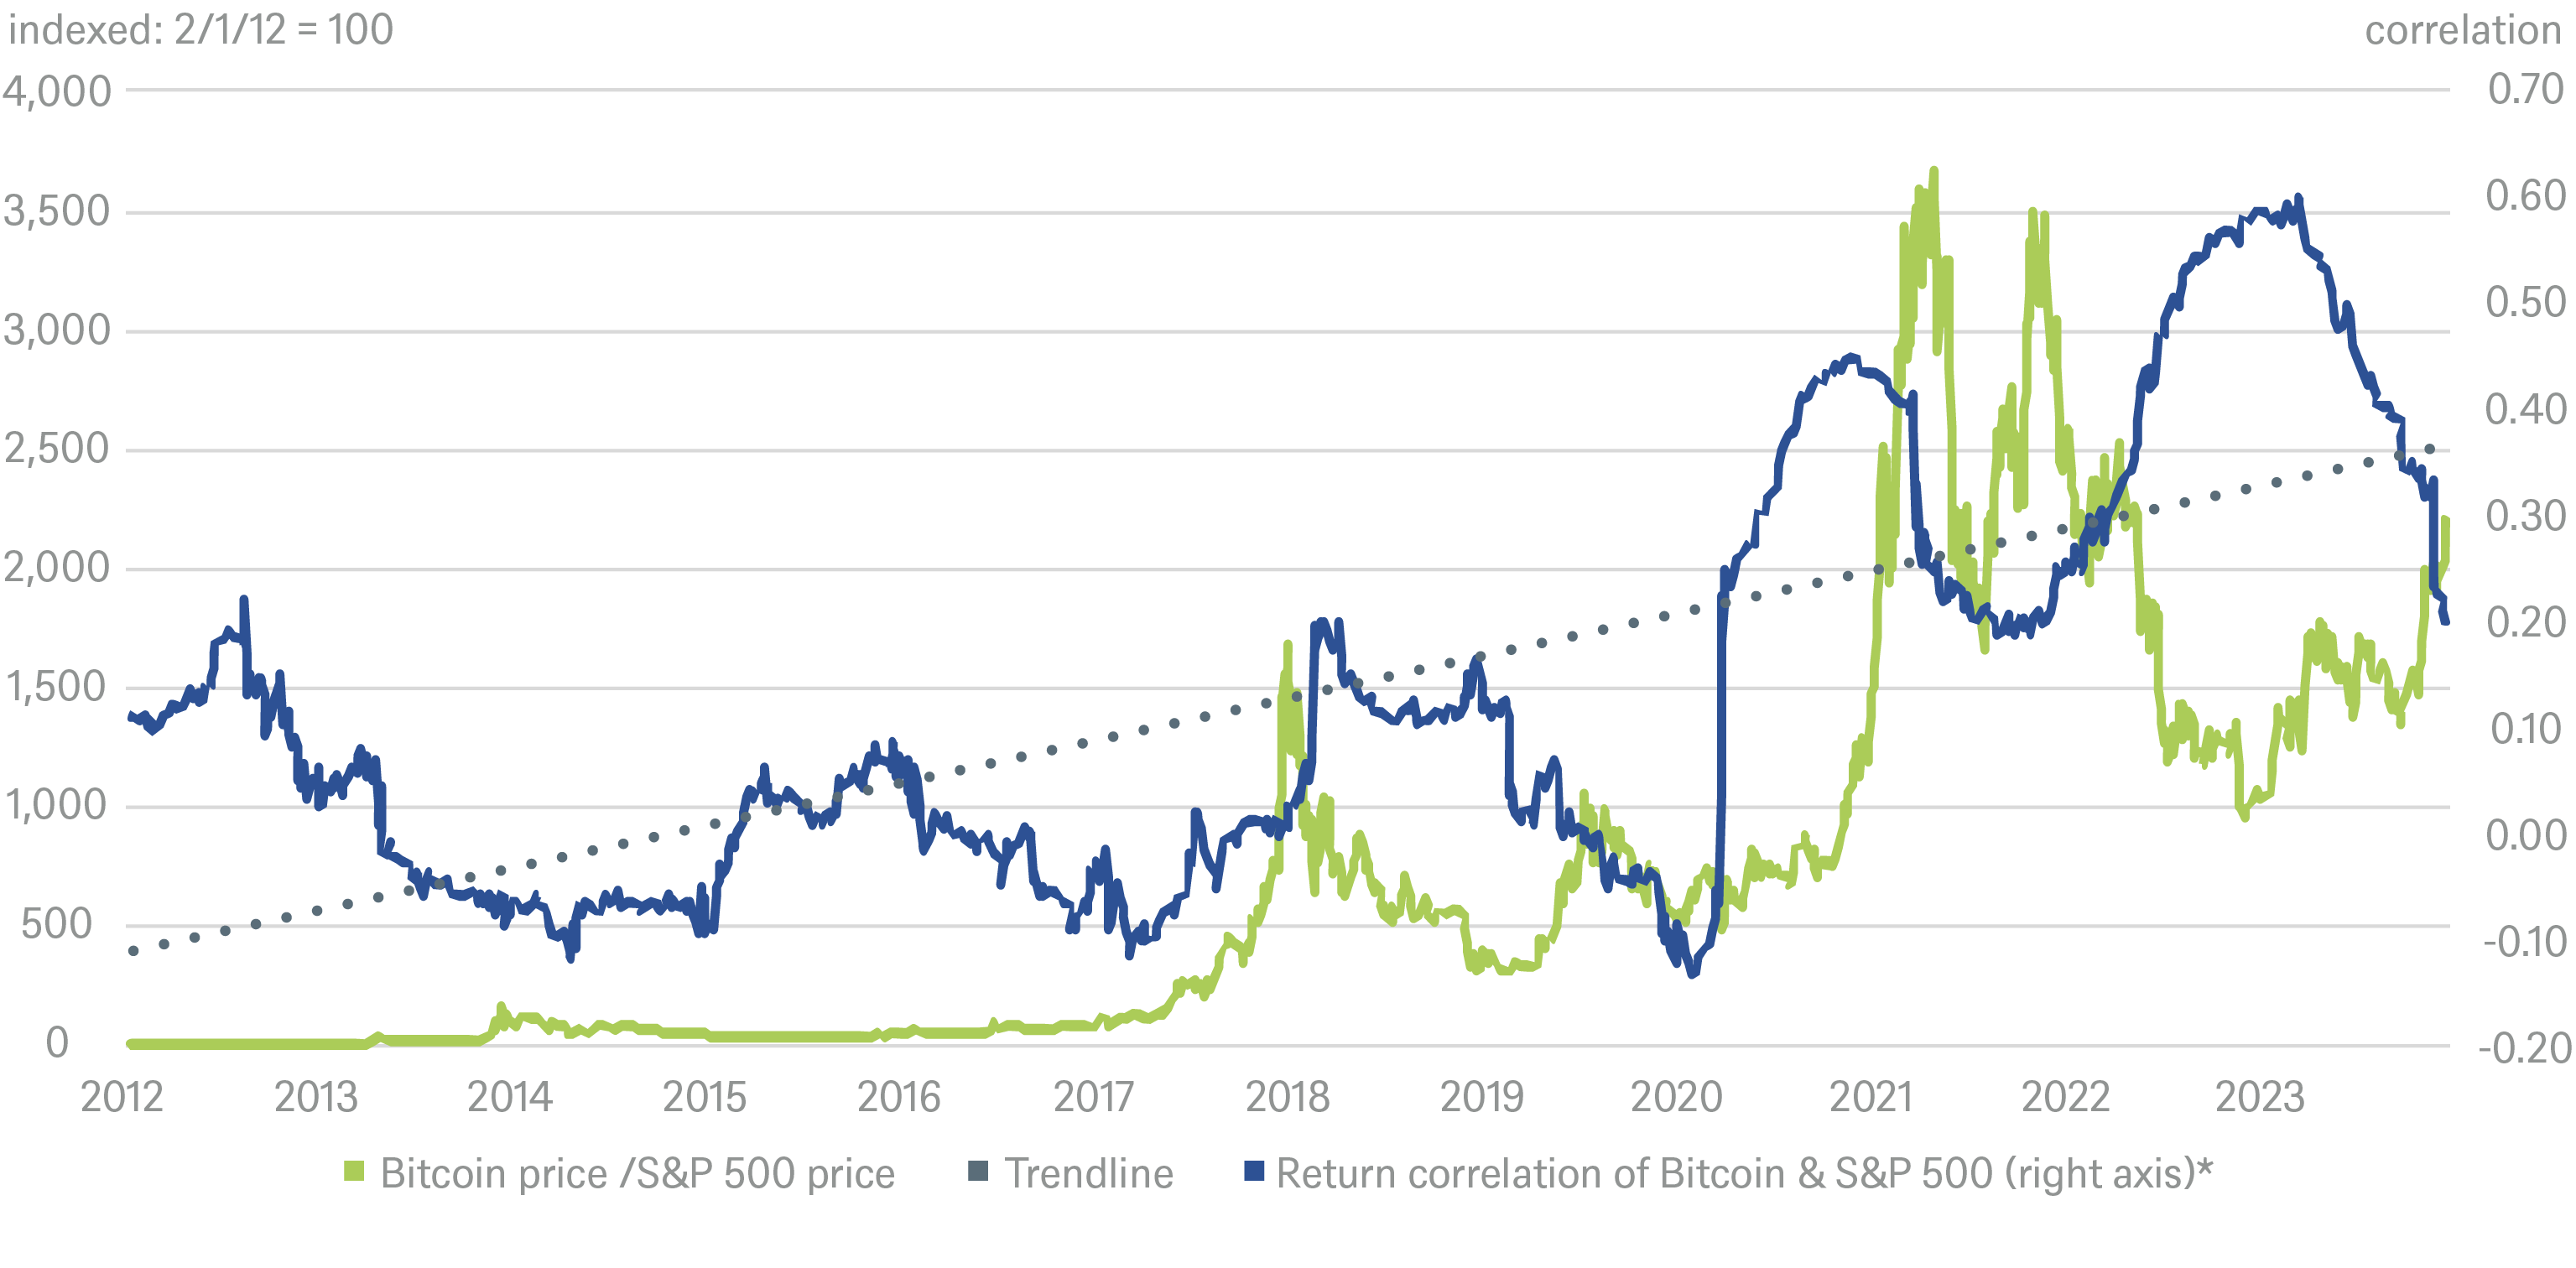
* 12-month rolling return correlation
Sources: Bloomberg Finance L.P., DWS Investment GmbH as of 12/5/23
In our Chart of the Week, we compare the performance of the oldest and best-known cryptocurrency, Bitcoin, with the performance of the S&P 500. Over the last 10 years, Bitcoin has outperformed the S&P 500 close to 2,200-fold.[3] At the same time, Bitcoin's returns have been notoriously volatile, which is perhaps unsurprising, given its evolving ecosystem, the wide range of plausible scenarios for future applications of Bitcoin and the still unfolding potential of its underlying blockchain technology.[4] Thus, Bitcoin's outperformance appears less impressive on a risk-adjusted basis.
Especially noteworthy in the chart is the rolling last 12-month correlation between daily Bitcoin returns and equity returns. As can be seen in the chart, the correlation sharply fluctuated around a low level of less than 0.2 for most of the observation period. Investors were therefore able to cushion price fluctuations in equities by investing in bitcoin and, perhaps more importantly, vice versa. Only since the start of the Covid pandemic has there been a clear trend break. Since then, the correlation between Bitcoin and the S&P 500 has risen significantly. Reasons for the increasing correlation between equities and cryptocurrencies could partly lie in the increasing adoption by retail and institutional investors that gained access to the young asset class via for example crypto trading platforms and crypto exchange-traded products (ETPs).[5] However, it would be premature to read too much into the tighter correlations post pandemic, not least given recent declines. We believe that the main reason for the spike in correlation is simply the sharp fall in all risky assets during the covid pandemic. It is a well-known feature of markets that correlations spike in times of turmoil.[6]


