
- U.S. central bankers indicate that they are most likely done raising interest rates and that cuts are likely in 2024.
- However, current inflation and labor market dynamics are at odds with the speed and the number of cuts markets have priced in.
- Higher for a bit longer implies lots of risks that now must be considered, but fears should not be overdone either.
As if 2023 itself wasn't volatile enough, the year ended with a big bang for the markets. The final Federal Open Market Committee (FOMC) meeting in December 2023 was seen as a pivotal moment: central bankers indicated that they were most likely done raising interest rates. This opened the door for rate cuts in 2024 and started a bidding war in markets over how low rates could go. The median of FOMC participants' individual projections of where the federal funds rate might be in the future now points to three rate cuts in 2024, one more than at the September meeting and one less than markets had been expecting just before the meeting. In addition, the economic projections show that FOMC participants were slightly more optimistic about the path of inflation, with everything else almost unchanged from their previous forecasts. It looked like central bankers were confirming that policy rates have reached cruising altitude, and after a while of cruising, the U.S. Federal Reserve (the Fed) will start to prepare for landing once the destination (sustainably lower inflation) is in sight. Markets, however, not only cheered, but they also unbuckled and jumped out of their seats. The usual announcement to remain seated and calm was made by the Fed Chair Powell in his prepared remarks during the press conference: As uncertainties and risks remain, the FOMC intends to proceed cautiously, meeting by meeting.[1]However, the party in markets continued when Powell was cross-examined during the Q&A part of the press conference. Some outlets even reported that “Powell Says Fed Discussed Timing of Rate Cuts at Meeting Today”.[2] Checking the press-conference transcript reveals that indeed rate cuts were a subject of discussion, but Powell clarified that it was a discussion in the context of individual projections and not in the form of talking through straightforward plans on how to and when to lower rates.[1]
But the genie is out of the bottle. Markets are currently pricing in round about six cuts[3] over the course of 2024, almost twice as many as FOMC participants indicated would likely be appropriate. Several central bankers tried to push back on such expectations after the meeting, not least because easing financial conditions could be counterproductive. By supporting growth, they risk rekindling inflation too. Chicago Fed’s Goolsbee even told the media that there seemed to be some confusion in markets on how the FOMC actually works.[4] As in previous interest rate cycles, it feels a bit like markets are cultivating a kind of confirmation bias, seeking for looser monetary policy of the sort seen throughout most of the past 20 years. And while there is a large body of literature explaining such biases, in the age of artificial intelligence (AI), it is more fun to conduct a little experiment that might be as helpful to assess the situation. We asked one of the most prominent AI-chatbots to watch the press conference, respectively read the PDF transcript, and to provide its interpretation on a scale of 0 to 10, with 0 being the most dovish and 10 being the most hawkish interpretation. Since such chatbots are trained on real data, or "common knowledge" including information about U.S. monetary policy but mostly of the fairly recent sort prevalent on the Internet, it should be able to interpret new information in context of what has happened in the past. Surprisingly, or rather unsurprisingly for us, the chatbot assigned a score of 6 to the last FOMC meeting which corresponds to a notion of slightly hawkish. Or to put it another way, if we accept the line of reasoning that the chatbot is comparing current information to past information correctly, the last meeting was indeed not as dovish as the markets interpreted it. The chatbot's justification for its “reasoning” are lingering risks around inflation, while at the same time central bankers are "...showing caution in the face of an economic slowdown...". We repeated this experiment, but commanded the chatbot to take a dovish-seeking perspective, e.g. like a bond investor who benefits from lower policy rates as bond prices increase. This setting resulted in a dove/hawk score of 4, which is slightly dovish in absolute terms and significantly more dovish in relative terms compared to the original outcome. But even in this setting, the chatbot did not let us go without suggesting that the overall tone of the meeting was still “moderately hawkish.” This is quite remarkable. Even if you tweak the chatbot towards a dovish bias, it seems to be less dovish than the markets have been. If you repeat this experiment with the subsequently released FOMC meeting minutes, you get a score of 5 for an unbiased interpretation and a score of 3 for the dovish biased interpretation. ed the training data itself is. Nonetheless, such tools could be an interesting way to analyze monetary In both cases, the interpretation appears to be more dovish than the meeting itself, but this is consistent with the observation that the minutes provided more information about the uncertainties and risks surrounding the economic outlook. Of course, we don't take this experiment too seriously. Even AI experts often struggle to fully understand the inner workings of such chatbots, including how bias policy statements in the future (stay tuned). What we take away from the experiment, however, is the inherent mention of potential risks to economic activity as we share these observations, both in terms of Fed thinking and as far as the U.S. economy itself is concerned.
Indeed, a reality check (in this case by a human) of the FOMC minutes from the December meeting shows that participants are torn between optimism about progress on dampening inflation and concern about the growing risks of the negative effects of higher interest rates on the economy. As a result, there was no overt discussion of a plan for when to cut rates - the current uncertainty forces the Fed to remain data dependent. This pretty well illustrates the dilemma central bankers face going forward, in terms of which state of the world will ultimately prevail in 2024. In the more benign one, the Fed can cut rates because economic conditions are converging to the desired level (e.g. the inflation target) and central bankers can fine-tune real rates. This is very different from a second, nastier situation, in which the Fed has to cut rates to support the economy because something breaks. In the latter case, the upside risks to inflation are likely to dissipate, while the downside risks to labor markets would determine their response. A third scenario would be that inflationary pressures turn out to be more persistent after all and the Fed continues to raise policy rates. That would increase the likelihood of a harder landing later. Paradoxically, it could pave the way to a scenario in which policy rates eventually must be lowered.
To understand where we are now, we first need to look at the three main components of inflation. First, there are energy and food prices, which are usually excluded from the Fed's reaction function because they tend to be volatile. A quick response to this volatility generally risks doing more harm than good. Changes in policy rates take time to work their way through the economy, and that can take longer than, say, energy price shocks, which tend to work themselves out naturally. That is why central bankers have chosen to target core inflation, which excludes volatile energy and food prices. This reminds us of two components that are relevant to the central bank's reaction function: durable goods prices and core services prices. In the case of durable goods prices, we know that one of the main sources of inflationary pressure in the recent past, namely limited supply due to global disruptions during the pandemic, is indeed normalizing (see Chart 1).
Chart 1: Abating supply chain pressures support the transitory narrative for durable goods prices
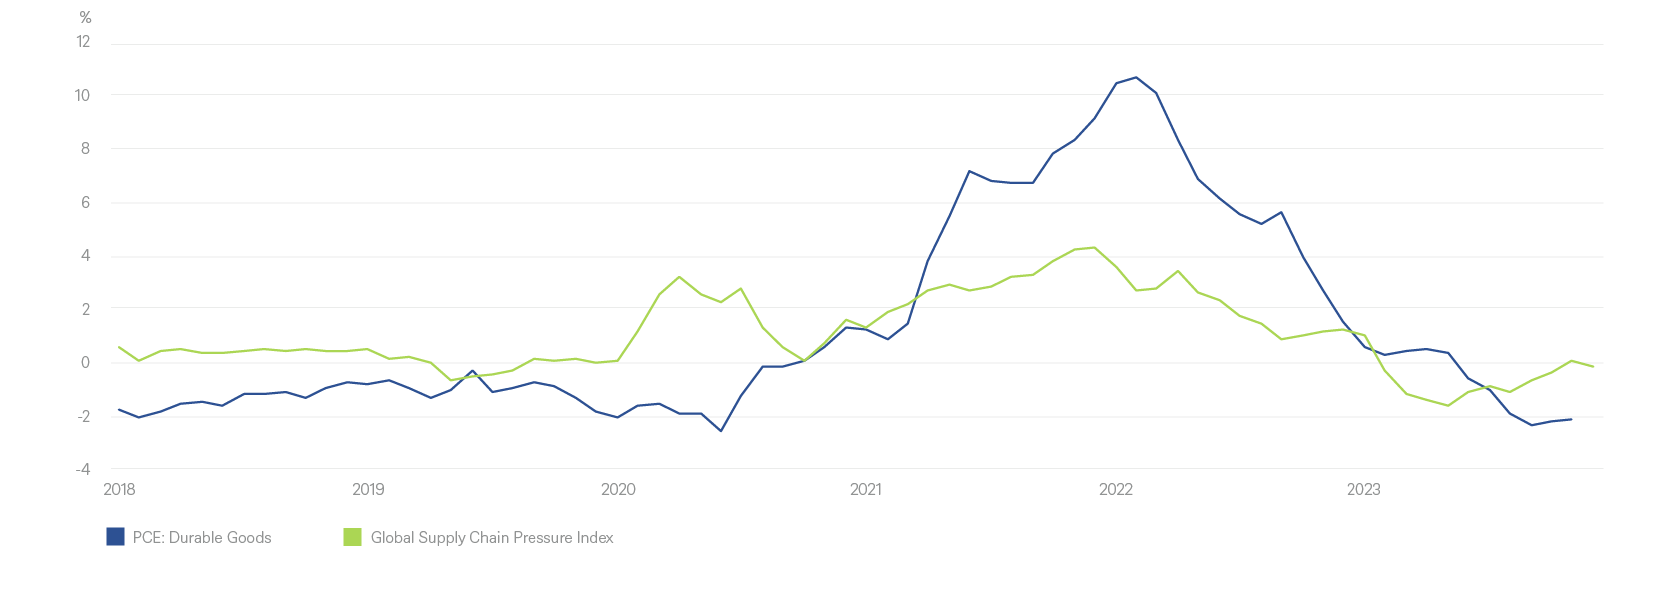
Sources: U.S. Bureau of Economic Analysis, Fed New York, Haver Analytics as of 01/11/2024
Initially, supply chain pressures did not affect prices, but they began to have an impact as consumers began to spend heavily once pandemic support payments arrived in their accounts. As global supply chain pressures eased and demand for goods shifted to services once economies around the world reopened, durable goods inflation rates began to cool and are now a significant negative contributor to overall inflation. From this perspective and with the benefit of hindsight, the transitory argument was a viable assumption — albeit with a longer lag than thought. Looking ahead, however, after much discounting of such goods, further downside is likely to be limited. The question that remains is whether the changing global landscape, with renewed geopolitical conflict in the Middle East and ongoing tensions in South Asia and Eastern Europe, could have a structural impact on both raw material and consumer durables prices going forward. The odds are that the impact will be far less dramatic than during the pandemic, but the current situation is probably not as benign as in the good old days before the pandemic or even before the trade wars started. All in all, we have to be a bit cautious about assuming that durable goods prices will be as much of a drag on inflation in the future as they have been in the past.
The final and most important piece of the current inflation puzzle remains the evolution of core services prices. A large part of this category is determined by the prices of shelter and rents. The good news is that shelter inflation rates can be expected to continue to moderate if the historical relationship with house prices and rents holds. The not-so-good news is that the extent of this appears to be limited, too, and could even be reversed by the end of 2024 as lower interest rates support demand for housing going forward. The remainder, that is, core services excluding shelter inflation, may - explicitly or implicitly – be the most hotly debated topic right now. For now, core services inflation excluding shelter remains elevated, and the common argument is that its development is closely linked to the tightness on labor markets[5] (Chart 2).
Chart 2: Core services ex. shelter vs. labor market tightness – a not so old relationship
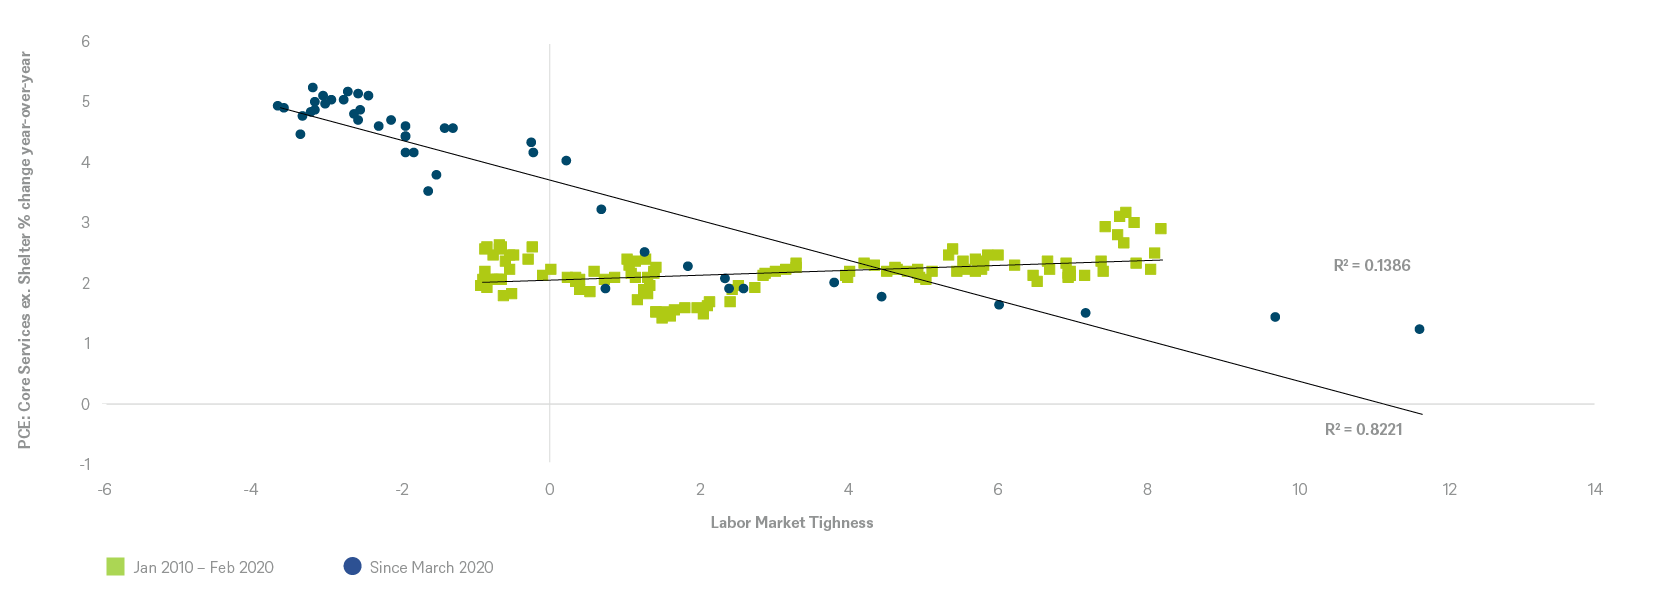
Sources: U.S. Bureau of Economic Analysis, Fed New York, Haver Analytics as of 1/11/24
The graph shows that in the decade before the pandemic, there did not appear to be a strong relationship between labor markets and higher service prices. It was not until the start of the pandemic that the relationship became quite significant. Moreover, it began to emerge before labor markets had recovered from the pandemic shock. This development was most likely due to fiscal support. While we already know that excess household savings appear to have largely disappeared, the persistent tightness in labor markets may take a little longer to unwind. Labor supply may remain more constrained than in the past as demographics change and some households continue to enjoy higher levels of wealth. Increased labor demand, or labor hoarding, may not disappear entirely, too, as re-shoring supports the war for talent. This may mean that we do not fully return to the wage and price dynamics that existed before the pandemic or the trade war stared in 2018. However, while we are already seeing labor markets move toward a more sustainable path, we still believe that current wage growth above 4% is probably not yet consistent with a sustainable path to 2% inflation.
Given what we have learned, the overall inflation picture most likely means that a bit more time is needed before the Fed can declare victory and can actually begin to lower policy rates. The key determinant will be what happens in the labor markets and, in particular, wage growth. But this is where it gets tricky for the central bank: In order to cool labor markets further, higher policy rates will be needed for a bit longer, and this always increases the risk of larger than intended downside drags to the economy in our opinion. And the list of potential risks to the economic outlook remains long. With excess savings running low, a large share of consumers may already be relying on other sources of financing to continue their spending. After being relatively muted through 2023 due to higher interest rates and tighter lending standards, credit card and other revolving debt borrowing picked up in November, and anecdotal evidence suggests that holiday shopping this time was characterized by buy-now-pay-later borrowing.[6] With higher interest rates and overall debt burdens rising, delinquency rates have already started to pick up, which could be an early indicator of a material slowdown in consumption (Chart 3).
Chart 3: Delinquency rates picked-up along higher policy rates
Sources: Board of Governors of the Federal Reserve System, Haver Analytics, DWS Investment GmbH as of 1/11/24
Still, household balance sheets are in good shape for now and continue to be supported by robust wage growth. At the same time, spending is already starting to slow. The start to the fourth quarter has been a bit disappointing on consumption, and downward revisions to the fantastic third quarter gross domestic product (GDP) numbers also suggest a bit less momentum in household spending than initially thought. And more generally, the wedge between GDP and relatively weaker gross domestic income (GDI), while improving somewhat with revisions, continues to tentatively suggest that economic momentum may not be as robust as the solid GDP numbers suggest (Chart 4).
Chart 4: Despite some improvement, still a large divergence between GDI and GDP
Sources: National Bureau of Economic Research (NBER), U.S. Bureau of Economic Analysis, Haver Analytics as 1/11/24
Higher interest rates and tighter credit conditions are also having an impact on businesses. Small businesses continue to report the lowest levels of credit availability since the early 2010s, so their optimism remains muted. More broadly, business sentiment remains mixed, in part because higher interest rates appear to be causing firms to "...reassess future projects, contributing to weaker business investment and hiring."[6] For the time being, it seems like businesses can cope well with higher interest rates, but in line with delinquency rates for consumers, new bankruptcy filings started to increase as well (Chart 5).
Chart 5: Bankruptcies back to pre-pandemic levels as government support fades and higher interest rates kick in
Sources: Administrative Office of U.S. Courts, Bloomberg LLC as 1/11/24
Another hot topic remains commercial real estate (CRE) loans, where 2024 may prove challenging. While delinquency rates for this type of loan remain relatively subdued for now, a relatively large portion — estimates range from $117 billion to $150 billion — of loans tied to the weakening office sector will need to be repaid or refinanced.[7] The office sector in particular came under pressure after the pandemic as demand for renting this type of property fell, with current estimates suggesting that only about half of all office space is occupied.[8] Lower income from rents, with higher interest-related costs and most likely lower valuations, could therefore pose a significant risk to the financial stability of the economy. This issue already ranked second on the Fed's risk “hit list” in the October 2023 Financial Stability Report, just below upside risks to inflation and policy rates, and seems to be back on the agenda, judging by recent discussion among FOMC participants.[9]
"Banking sector stress" and "market liquidity strains and volatility" follow in third and fourth place. How worrying are these? Well, we have learned by 2023 that officials can indeed deal quite efficiently with idiosyncratic problems at smaller banks and there are no immediate signs of banking sector stress in general due to higher policy rates. The same goes for market liquidity. In general, this topic has been discussed quite controversially after the experience of the repo market crisis in September 2019. Among other things, declining bank reserves have been blamed for at least exacerbating the liquidity squeeze that pushed up overnight repo rates and forced the Fed to stop quantitative tightening. However, the introduction of a standing reserve repo facility in 2021 should prevent such scenarios from recurring by acting as a backstop. In any case, the minutes of the most recent FOMC meeting show that central bankers have already begun to consider slowing and eventually stopping the reduction of the balance sheet “...somewhat above the level judged to be consistent with ample reserves.” Overall, both issues remain a known unknown as with this kind of risks the slightest hint is enough to trigger massive reactions. Should such risk materialize, financial conditions get stressed with amplified consequences for households and businesses seeking to finance themselves, triggering further spirals of supply and demand that can end up in a sustainable weakening of the labor market.
Last but not least, when you think about the risk of higher interest rates, you have to think about U.S. government debt. For us, this discussion has two parts: a short-term story and a long-term tragedy. Recently, a lot of attention has been paid to the rising budget deficit of the federal government, which will have risen from -3.9% in 2022 to around -7.5% in 2023. The main reason for this deficit is not a short-term increase in so-called non-interest spending (total federal spending as a percentage of GDP is actually declining), but rather a decline in revenues and an increase in interest payments on the national debt. For fiscal year (FY) 2023, revenues fell from 19% of GDP in 2022 to 16% of GDP (close to pre-pandemic levels). The main reasons are lower capital gains taxes due to underperforming asset markets, tax filing extensions due to disasters, tax bracket adjustments due to inflation, and potential tax avoidance by taxpayers amid higher interest rates. On the other side of the government ledger, interest payments on the national debt have risen from 2.8% of GDP at the end of FY2022 to 3.2% of GDP in FY2023, and are slightly lower if only net interest payments are considered (see Chart 6).
Chart 6: Interest payments as % of GDP on the rise amid higher re-financing costs
Sources: U.S. Bureau of Economic Analysis, U.S. Treasury, Haver Analytics as as of 1/11/24
Historically, these are the highest levels since the period of low interest rates that began after the Great Financial Crisis. While we can expect these payments to rise somewhat further this year, the upside appears limited, at least from a market perspective. The average maturity of outstanding U.S. Treasury securities is about six years, which reduces the average interest rate on this debt to about 3%. This means that not all of the outstanding debt will need to be refinanced at higher market yields, and the markets' elevated expectations for rate cuts should also keep this in check.
The real tragedy, however, remains the outlook for the absolute level of government debt and the political processes behind it. While budget discussions are always volatile in nature, and we have faced the threat of a government shutdown on more than one occasion, the recent deterioration in fiscal management, as well as what appears to be a longer-term unsustainable path for government finances, was reason enough for a major rating agency to lower its rating from AAA to the second-highest of AA+. Indeed, a total debt-to-GDP ratio of around 100% (considering only debt held by the public) is most likely inconsistent with the highest possible rating. Moreover, the Congressional Budget Office's (CBO) own projections indicate that this ratio could rise to 115% by 2033 and 144% by 2043. This is a cause for concern, especially since the CBO tends to calculate such ratios using more favorable economic assumptions.[10]
It remains to be seen how policymakers will address this issue, but ultimately there are only a few options: reduce spending, increase revenues (taxes), or — and here, there is much hope — increase productivity, notably through technological advances such as artificial intelligence. At this point, we always like to emphasize our interpretation of the Solow productivity paradox: Observers tend to overestimate the impact of new meaningful technologies in the short run and underestimate their consequences in the long run. As for the short run, and in the absence of evidence to support the productivity hopes, we think the upcoming elections will introduce a lot of volatility into the debate over taxes and spending. Ultimately, efforts at fiscal sustainability imply that we should have less hope for fiscal policy to support economic growth — perhaps even in the longer run. The good news, however, is that the downside risks in the near term remain limited.
All in all, there does seem to be a narrow path to the Fed's desired soft landing. A lot can go wrong, and any deviation from that narrow path would most likely entail a sustained weakening of the labor market. The implication would be that the Fed would indeed be forced to cut rates, not just that it can do so because of inflation subsiding. We continue to believe that the Fed will need to keep rates higher for a bit longer than markets currently expect. As a result, a soft patch in demand in the first half of 2024 could help their efforts and be the trigger for an eventual rate cut.
Overview: key economic indicators
|
2023 |
2024 |
|||||||
|
Q1 |
Q2 |
Q3 |
Q4F** |
Q1F |
Q2F |
Q3F |
Q4F |
|
|
GDP (% qoq, annualized) |
2.2 |
2.1 |
5.3 |
0.8 |
0.0 |
-1.0 |
0.8 |
1.0 |
|
Core inflation (% yoy)* |
4.4 |
3.2 |
3.4 |
3.3 |
3.2 |
2.8 |
2.6 |
2.5 |
|
Headline inflation (% yoy)* |
4.8 |
4.3 |
3.7 |
3.4 |
3.2 |
2.6 |
2.4 |
2.3 |
|
Unemployment rate (%) |
3.5 |
3.6 |
3.8 |
3.7 |
4.0 |
4.1 |
4.2 |
4.3 |
|
Fiscal balance (% of GDP) |
-6 |
-6 |
||||||
|
Federal funds rate (%) |
4.75 - 5 |
5 - 5.25 |
5.25 - 5.5 |
5.25 - 5.5 |
5.25 - 5.5 |
5 - 5.25 |
4.75 - 5 |
4.5 - 4.75 |
*Personal Consumption Expenditures (PCE) Price Index
** Forecast
Source: DWS Investment GmbH as of 01/11/2024
Forecasts are not a reliable indicator of future returns. Forecasts are based on assumptions, estimates, views and hypothetical models or analyses, which might prove inaccurate or incorrect.


