- Home »
- Insights »
- DWS Research Institute »
- DWS Long View - 2024

- AI: Impact on Growth and Productivity
- A longer time frame leads to more consistent equity-return forecasts
- Connecting our Long View with portfolios in practice
Click here to download the full paper.
Executive summary
Coming into 2023, the economic consensus called for a shallow recession. Surprisingly resilient labor markets helped support global growth, helped to propel robust investment returns across equity and credit asset classes. While interest rate volatility has somewhat normalized from the previous year, stubborn but slowing inflationary pressures pt nominal yields high and sovereign bond curves flat and inverted across numerous developed market economies. As central banks gradually shift back toward easy monetary policy, the magnitude and pace of rate normalization remains a point of macroeconomic uncertainty.
Entering 2024, return forecasts are modestly lower versus a year ago. Valuations across equity and credit markets are modestly more demanding, and medium and longer-term sovereign bond yields, despite a volatile year, ended 2023 largely unchanged from the previous year. Looking forward over the next decade, fixed income nominal return forecasts still look robust versus the previous decade driven by higher yield levels as interest rates have largely normalized following over a decade of quantitative easing (“QE”). Despite some compression in equity return forecasts driven by more challenging valuations, growth and income return pillars still look quite constructive, and nominal returns do provide some diversification against the risk of persistent inflation.
As interest rate policy transitions back toward a more normal environment, the neutral level of real interest rates remains a key question that will ultimately impact fair value across asset classes. Over a strategic horizon, global growth prospects continue to trend lower, reflecting a shifting demographic landscape, with working-age populations in secular decline. Nonetheless, positive real interest rates across many developed economies and only modestly expensive valuations across equity and credit complexes leaves investors at a far more favorable starting point for this coming decade. Taking these factors into consideration, we present our long-term ten-year return forecasts across asset classes which we refer to as our “Long View”.
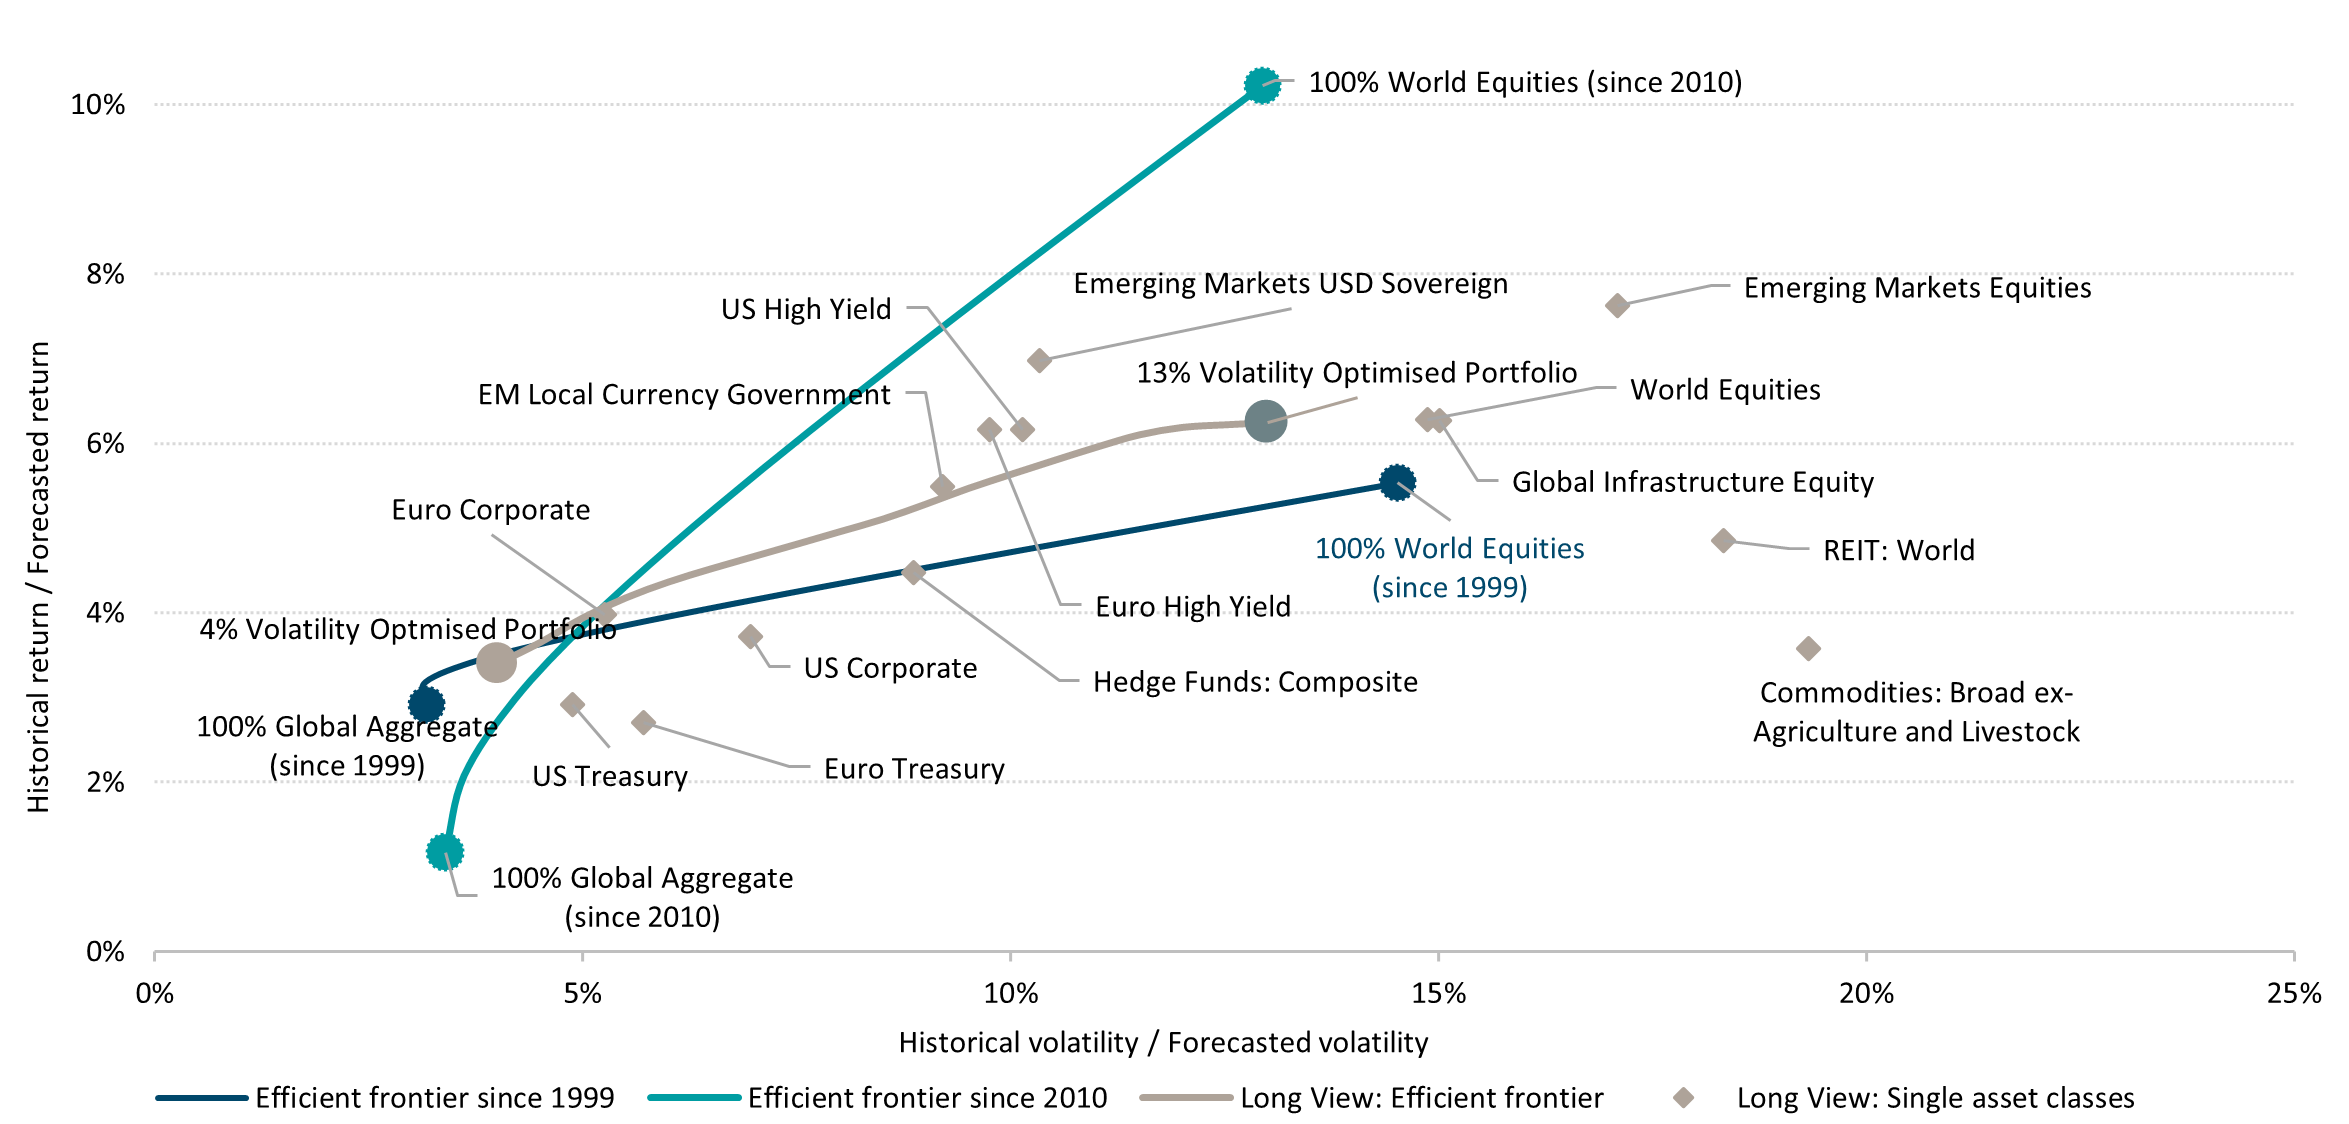
In our Long View, we show our forecasted returns across asset classes and regions on the efficient frontier, which represents the trade-off investors must make between risk and returns. Figure 9 depicts the efficient frontier over the last thirteen years since the credit crisis and compares it to the efficient frontier over the past two decades. As seen, the post-financial crisis efficient frontier is steeper. What this suggests is on a relative basis, investors received far greater compensation for commensurate levels of risk in the decade following the financial crisis.
Figure 9: Efficient frontiers: 10 year forecasted and historical returns and volatilities, annualised
This publication details the long-term capital market views that underpin the strategic allocations for DWS’s multi-asset portfolios. These estimates are based on 10-year models and should not be compared with the 12-month forecasts published in the DWS CIO View.
Central to this document is our belief that clients should consider a long-term perspective beyond 1-5 years when it comes to constructing investment portfolios. Perhaps, counterintuitively, extending the investment horizon has, in the past, produced less volatile, more precise forecasts, as shown in while risk still matters and there is still a distribution of investment outcomes around any central forecast, this distribution has tended to become narrower when investing for longer investment horizons. One consequence of this is that entry points become less relevant (even though of course by no means irrelevant) for longer investment horizons (because cyclical and tactical drivers are overtaken by fundamental, structural drivers of asset class returns). This is true even at times of extreme valuation: taking one of the biggest previous bubbles (the dot.com boom) as an example, the difference between buying US equities exactly at the peak of the dot.com boom in April 2000 vs. a year later (after valuations had collapsed) only amounts to one percent compounded annually when investing with a 15-year time horizon (as we show in Figure 22 on page 19). However, if an investor had had a shorter horizon of five years, the difference in returns generated from buying at the peak versus one year later was far greater, amounting to roughly six percent per annum. Thus, the longer the holding period for an investment, the stronger the case that its return is primarily driven by the underlying fundamental building blocks.
Looking at rolling one-year price returns of the S&P 500 from 1871 to 3, a negative two-standard-deviation move equated to a 27 percent decline in prices (1). When calculating a negative two-standard-deviation move using rolling 10-year returns over this same time frame, the decline in prices is less than 1 percent per annum. More stable long-run returns can be helpful in establishing more stable strategic-asset-allocation targets. Hence, may be surprised to learn that the volatility of returns historically has been lower when using long-term horizons, although past performance may not be indicative of future results.
Figure 10: Asset allocation and risk allocation by target volatility
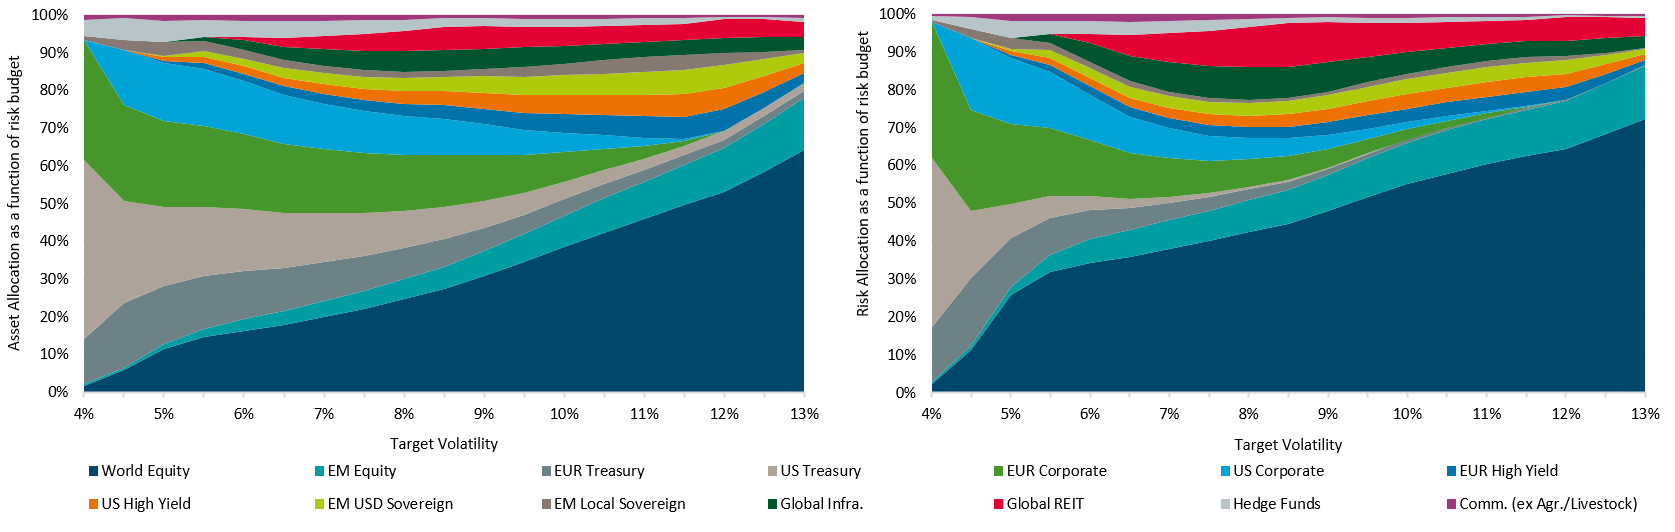
Source: DWS Investments UK Limited. Data as of 12/31/22. For illustrative purposes only. See page 29 for details. See appendix for the representative index corresponding to each asset class.
Figure 11: Distribution of U.S. equities: Historical returns over different holding periods, annualised
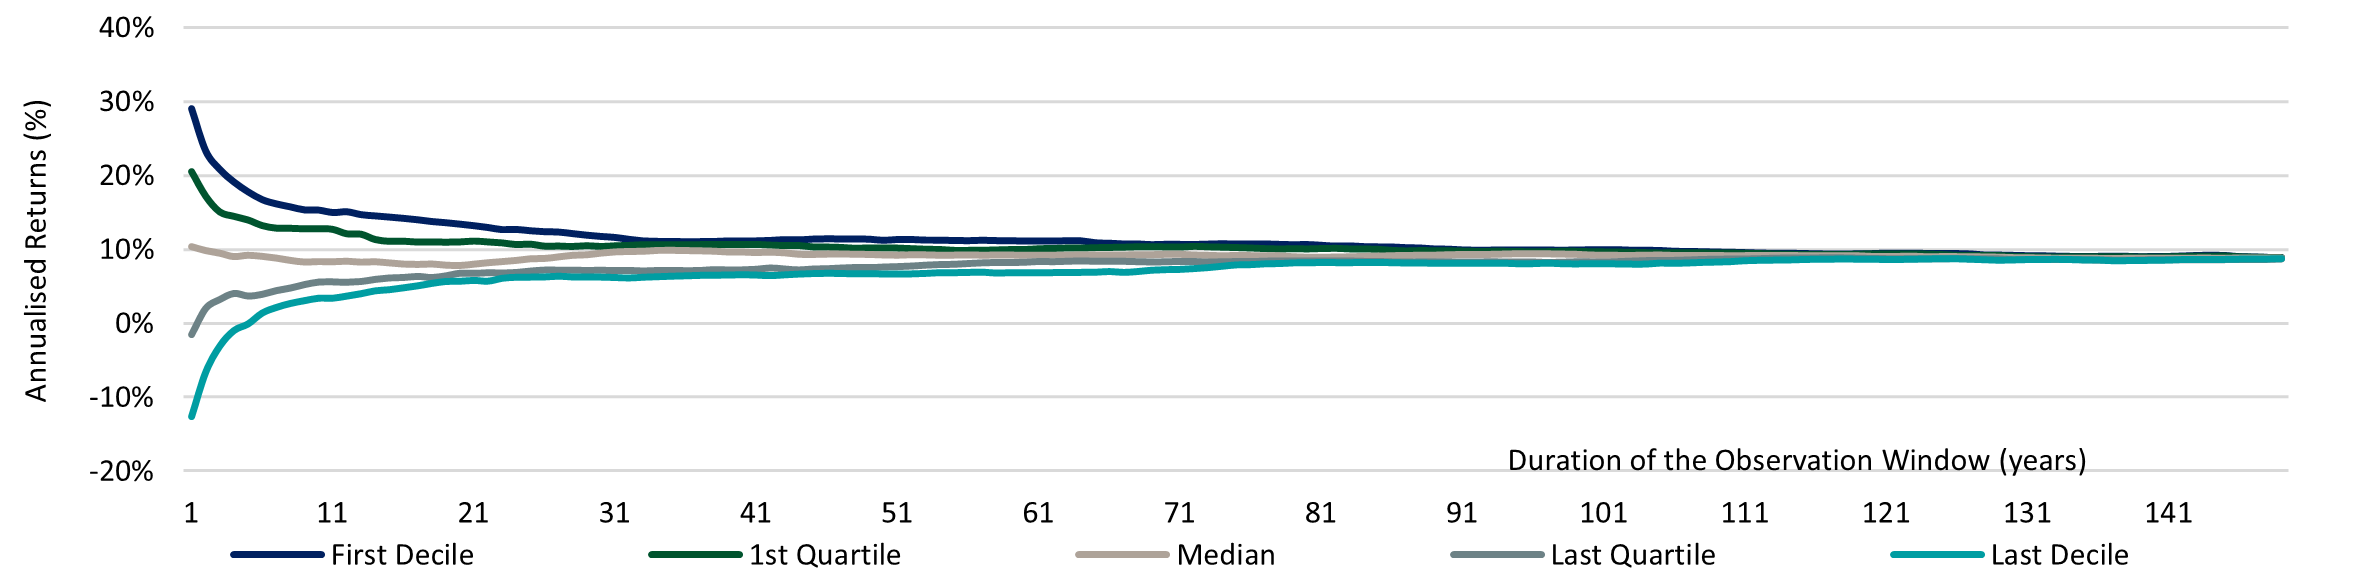
Source: Robert J. Shiller, DWS Investments UK Limited. Data from 1871 to 2023.
Framework
We use the same building-block approach to forecasting returns irrespective of asset class. We believe this approach brings consistency and transparency to our analysis and also may help clients to better understand the constituent sources of forecasted returns.
The Long View framework breaks down returns into three main pillars: income + growth + valuation, each with their own sub-components. The pillars and components for the traditional asset classes under our coverage (equities, fixed income and commodities) are show in Figure 12.
Meanwhile, alternative asset classes under our coverage (listed real estate, private real estate, real estate debt, listed infrastructure equity and private infrastructure debt) are forecasted using exactly the same approach, sometimes with an added premium to account for specific features, such as liquidity.
Figure 12: Long View for traditional asset classes: Pillar decomposition
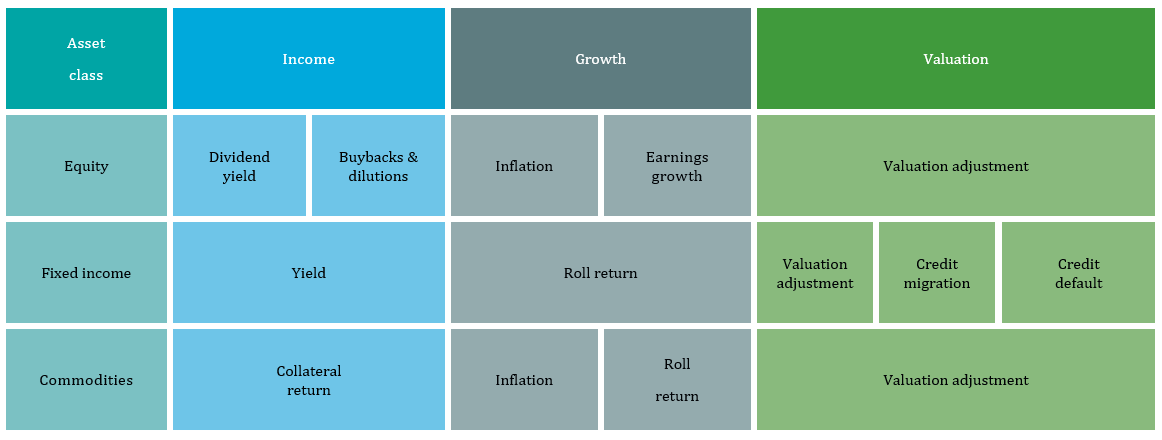
Source: DWS Investments UK Limited
Figure 13: Long View for alternative asset classes: Pillar decomposition
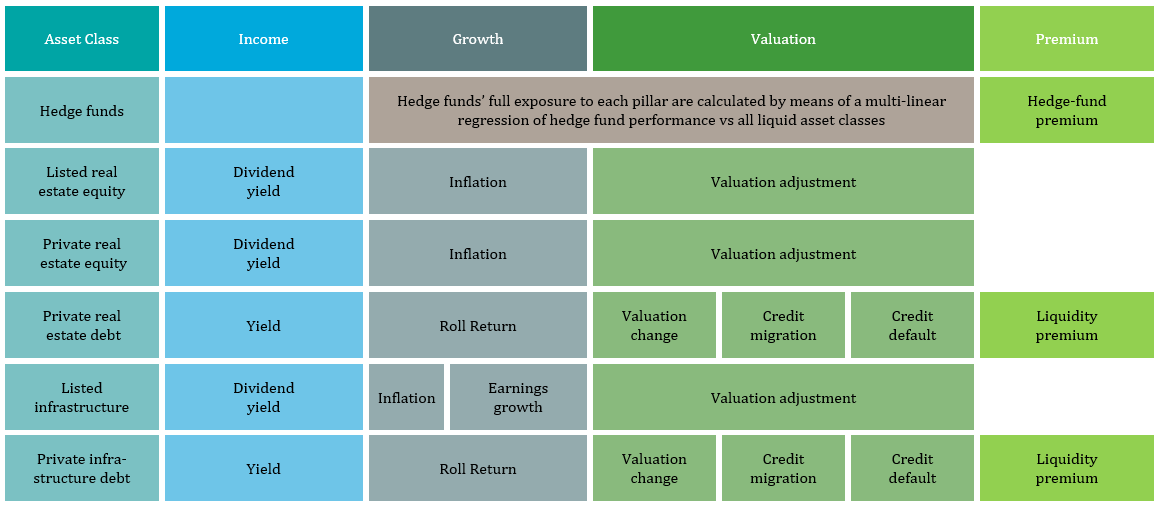
Source: DWS Investments UK Limited.
Return forecasts
Our Long View forecasts for all asset classes can be seen below. The bars are ranked by ascending forecasted return within each asset class.
In summary, we make the following key observations from the results:
- Return forecasts across equities have significantly increased from last year’s forecasts; in Europe and EMs they are now in line with or modestly above the realized returns over the past decade, whereas in US equities they are still well below the strong realized returns over the past 10 years.
- Across regional equity markets, the emerging markets are expected to offer the highest forecasted returns, but only marginally ahead of some European markets and the US.
- Fixed income return forecasts show the most positive change, both versus the previous year’s forecasts and relative to the previous decade. Both core fixed income and credit offer higher nominal return outlooks, given high current starting yield levels.
- Within credit, (across IG and HY corporates as well as sovereign and corporate EMD), return forecasts are well above previous decade returns. EM USD sovereign and corporate debt in particular are the highest across credit asset classes.
- Alternative asset class return forecasts at in line with to modestly below traditional asset class forecasts. Within alternatives, infrastructure equity has the highest return outlook. Decline in private RE equity forecasts reflect both a methodology change to earnings contribution but more importantly less attractive valuations relative to TIPS yields.
- Commodity future return forecasts are healthier now than the very poor realized returns of the previous decade and could provide useful diversification benefits and potential inflation protection.
Investors should be conscious of the impact of foreign-exchange (forex) risk on base-currency returns and volatilities. Depending on risk appetite and return objectives, investors may want to consider hedging currency risk.
Figure 14: Forecast and realised returns for 10 years, annualised (local currency)
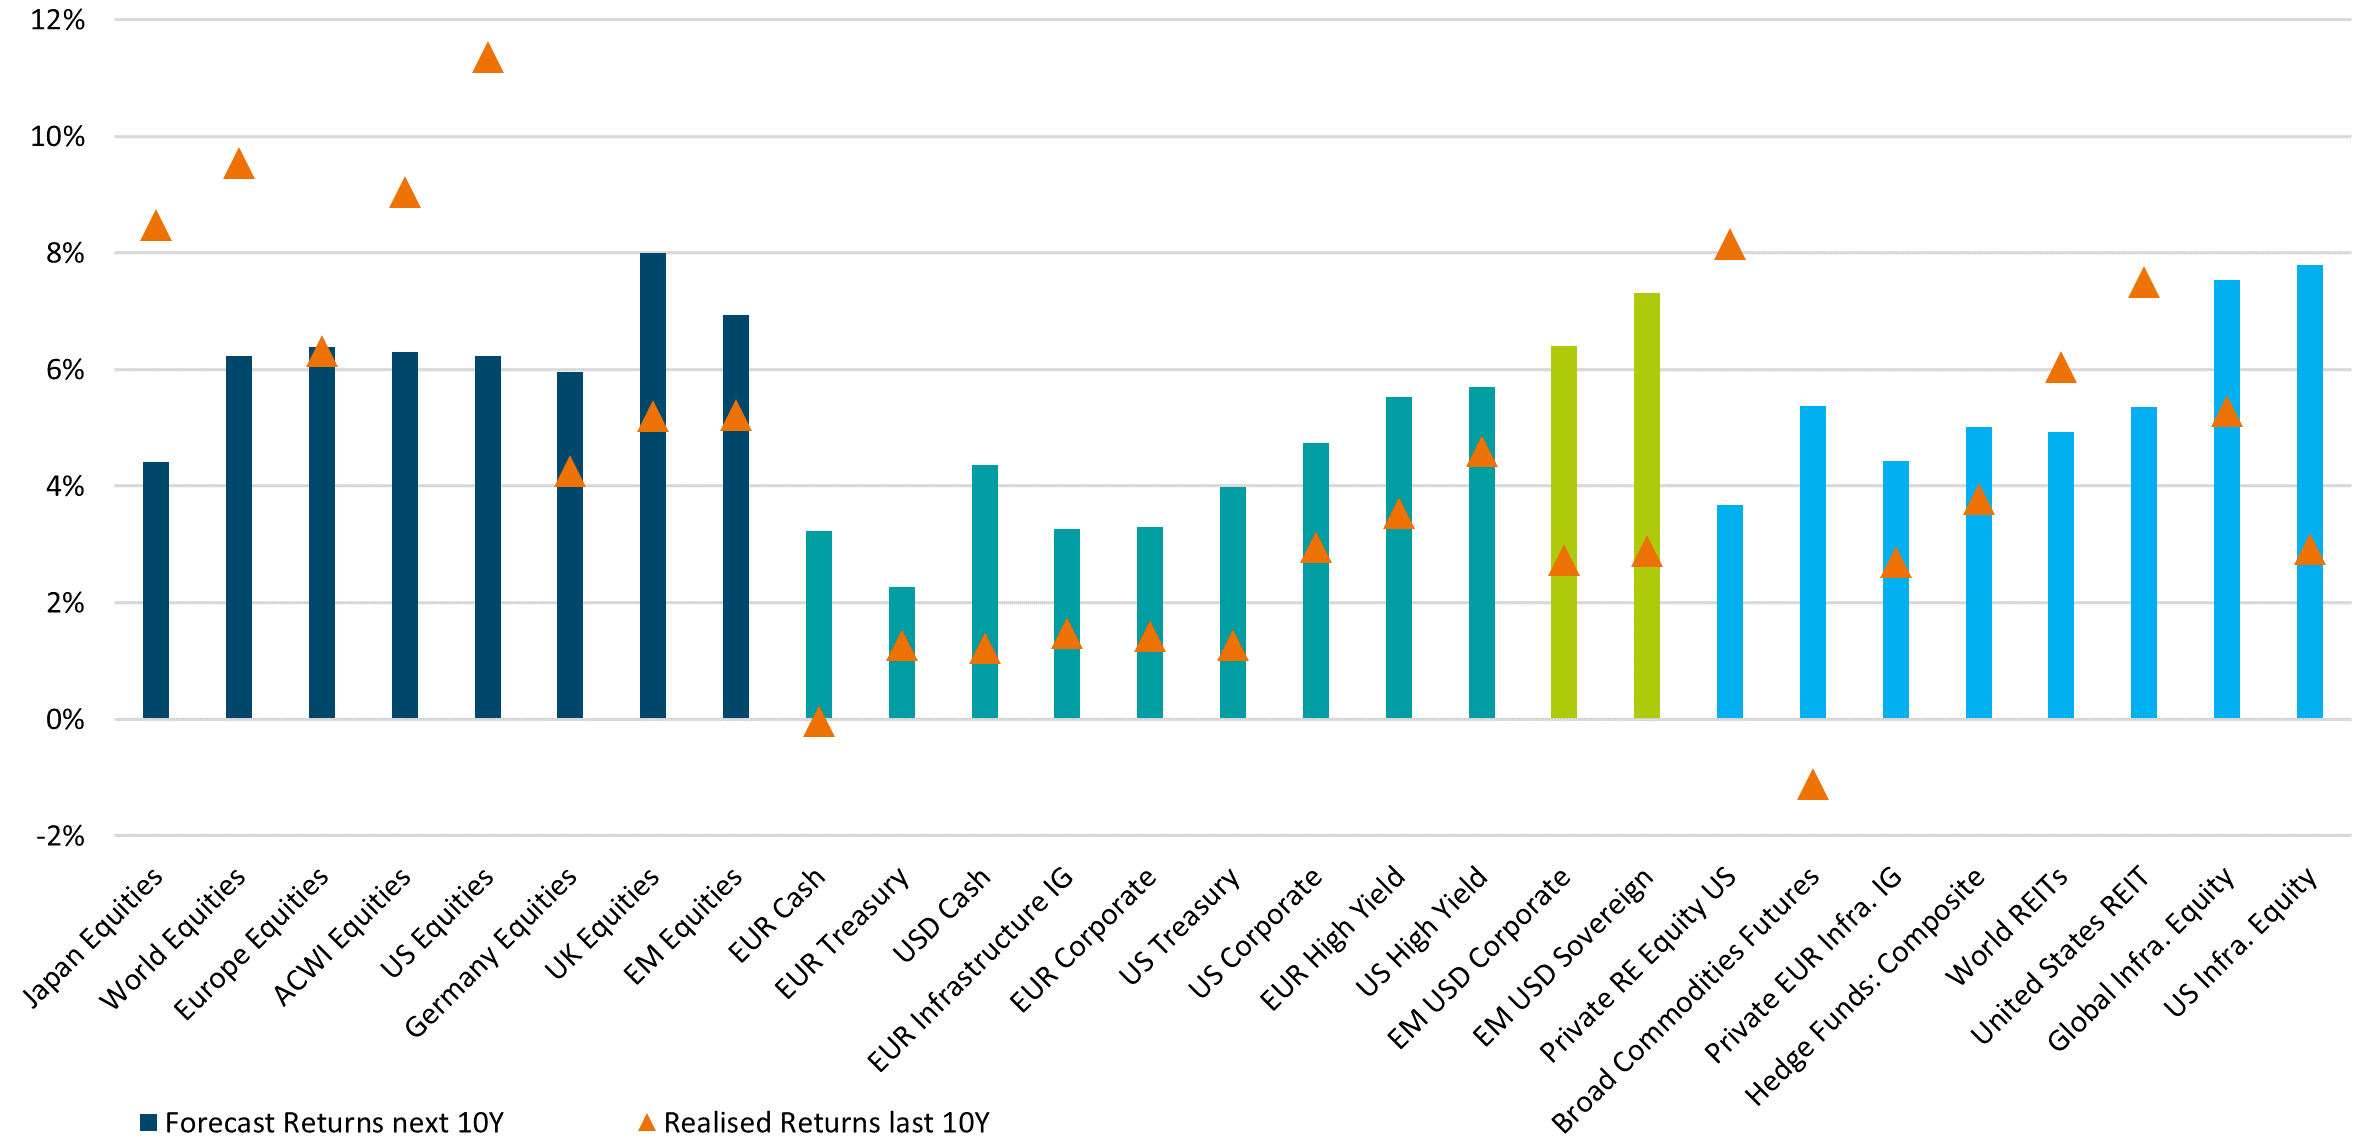
Source: DWS Investments UK Limited. As of 12/31/23. See appendix for the representative index corresponding to each asset class


