- Home »
- Insights »
- DWS Research Institute »
- DWS Long View - 2023
- Return forecasts in almost most asset classes are materially higher versus previous years, reflecting higher yields and less prohibitive valuations
- Addressing inflationary pressures with the backdrop of elevated sovereign debt balances may be challenging for central banks
- The potential impact of monetary policy missteps on asset class returns would be quite significant
Click here to download the full paper.
Executive summary
Market conditions look drastically different than even a year ago. Stubborn price pressures and an unexpectedly resilient labor market have necessitated a historically aggressive interest rate cycle from global central bankers. As a result, nominal yields across the fixed income complex have moved significantly higher. Market-implied real interest yields have also moved back to significantly positive levels not seen in over a decade. Valuations across equities and credit markets have also become less demanding after a period of market weakness, reflecting both higher and less certain discount rates.
In aggregate, we start 2023 with asset price valuations at much less prohibitive levels relative to recent years. Uncertainty exists in the macroeconomic landscape, where resilient labor and consumer demand is now the focal point for policymakers. As interest rate policy transitions back toward a more normal environment, the neutral level of real interest remains a key question that will ultimately impact fair value across asset classes. Over a strategic time horizon, global growth prospects continue to trend downward, reflecting a shifting demographic landscape, with working-age populations in secular decline. Nonetheless, positive real interest rates across many developed economies and less expensive valuations across equity and credit complexes leaves investors at a far more favorable starting point for this coming decade. Taking these factors into consideration, we present our long-term ten-year return forecasts across asset classes which we refer to as our “Long View”.
In our Long View, we show our forecasted returns across asset classes and regions on the efficient frontier, which represents the trade-off investors must make between risk and returns. Figure 16 depicts the efficient frontier over the last thirteen years since the credit crisis and compares it to the efficient frontier over the past two decades. As seen, the post-financial crisis efficient frontier is steeper. What this suggests is on a relative basis, investors received far greater compensation for commensurate levels of risk in the decade following the financial crisis.
Figure 16: Efficient frontiers: 10 year forecasted and historical returns and volatilities, annualised
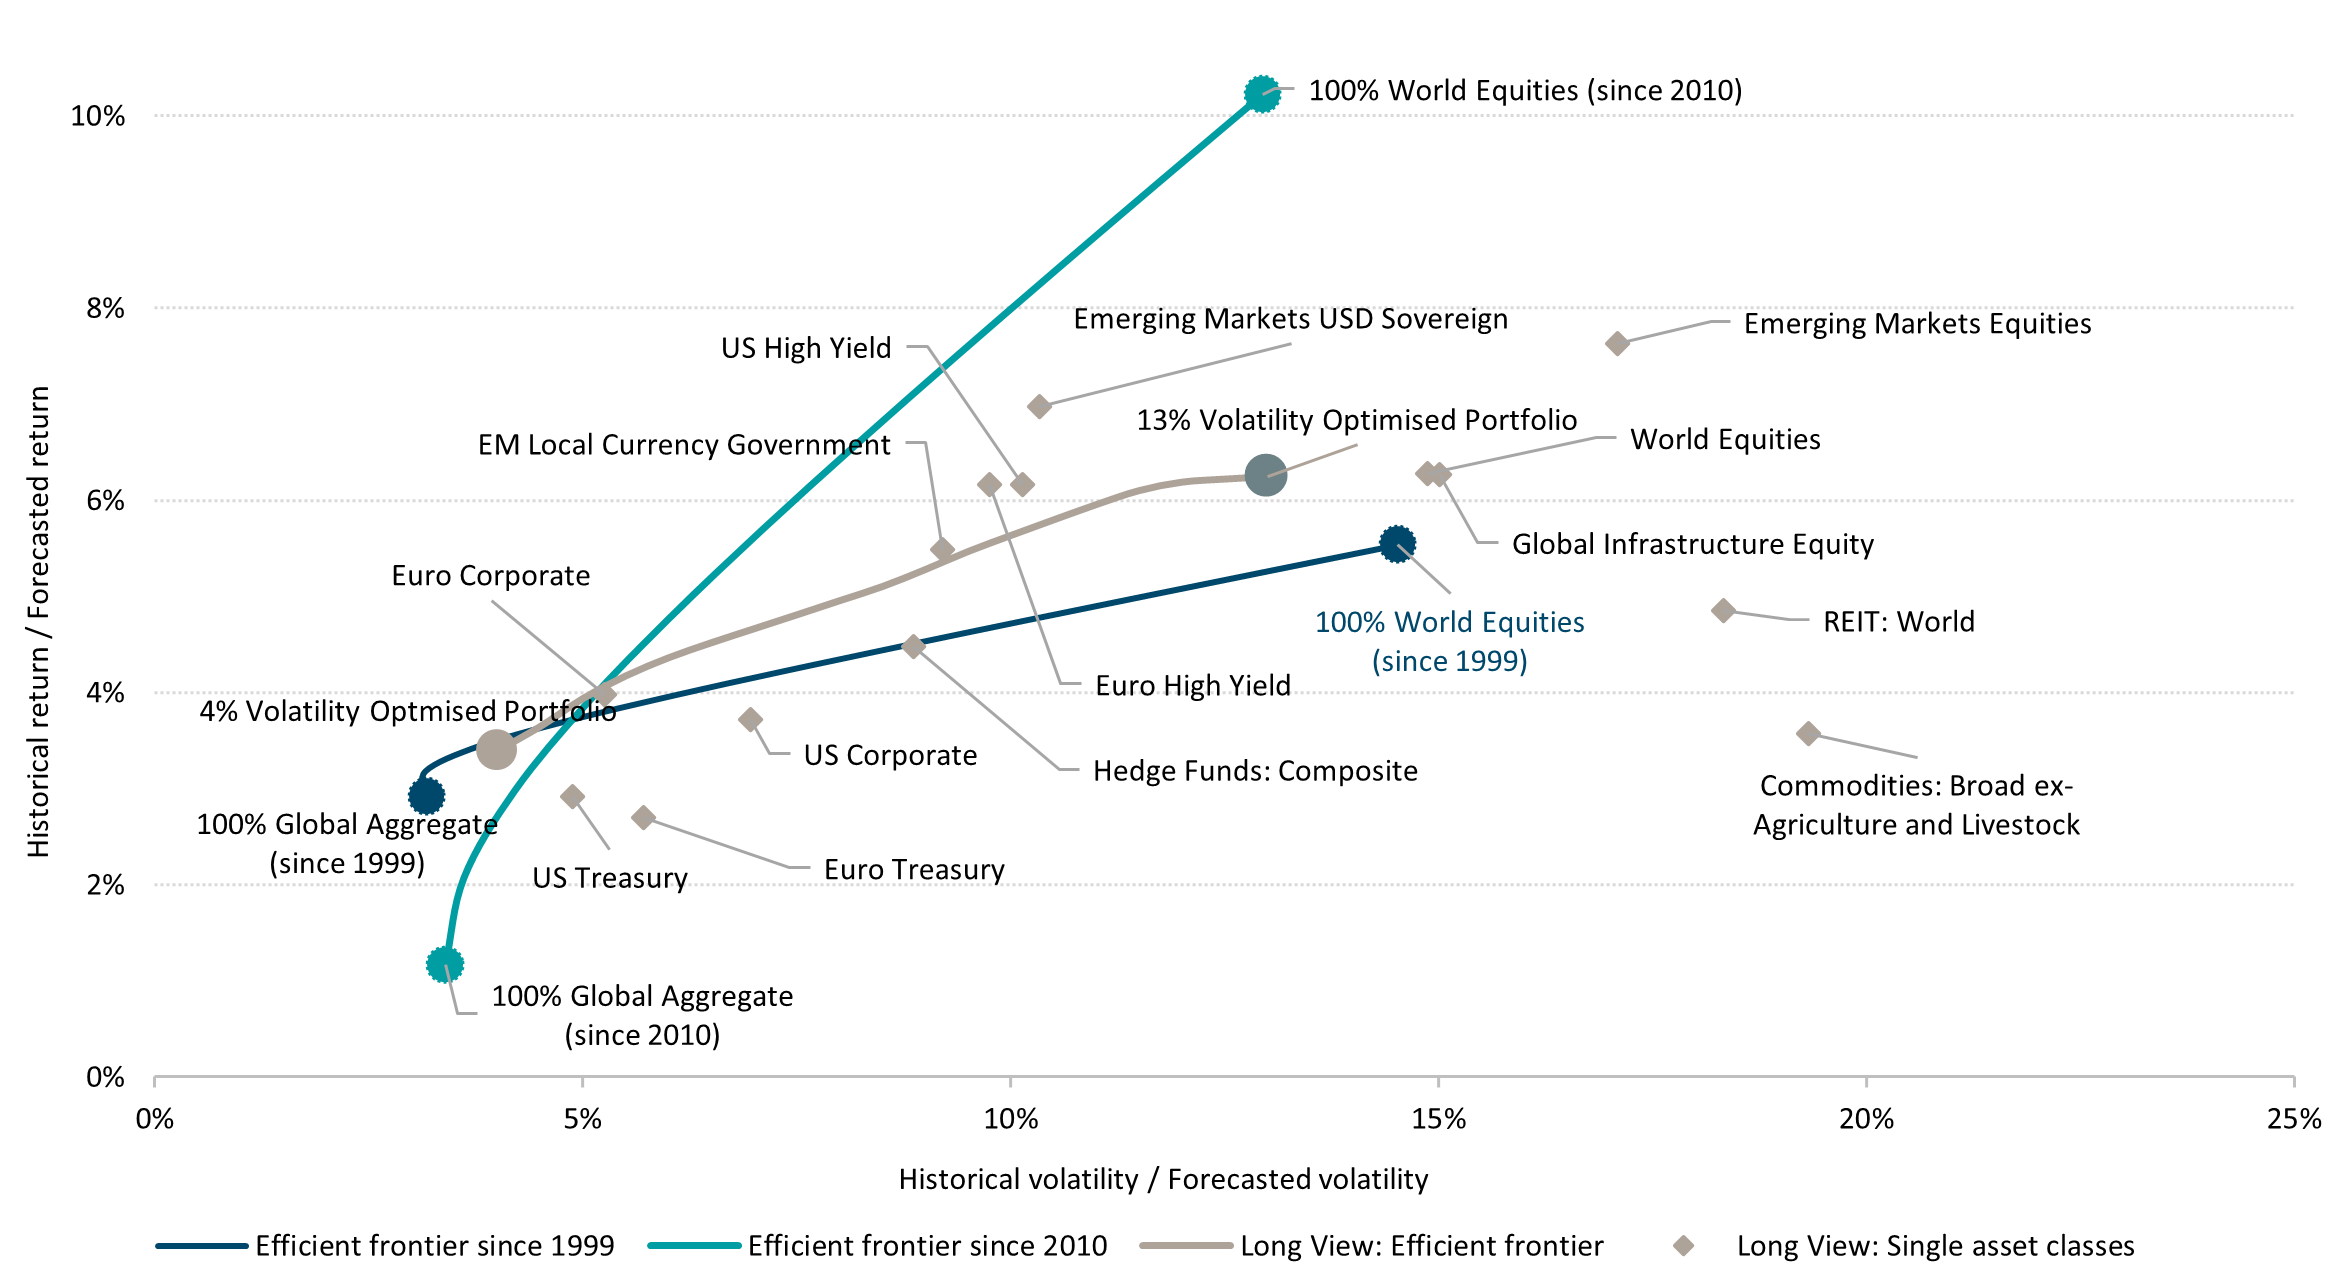
Historical Efficient Frontiers are noted above as “Efficient Frontier” and are calculated using historical returns and volatilities over the time frame noted through 12/31/22. Each historical efficient frontier represents the risk-return profile of a portfolio which consisted of two asset classes; World Equities (in euro, unhedged) and Global Aggregate Fixed Income (euro-hedged). The Long View Efficient Frontier represents a forecasted optimal portfolio (EUR) using the various asset classes represented in the figure, subject to certain weighting/concentration constraints that result in component asset classes being able to trade above the line in this instance (please see page 28 for more details on these optimization techniques). Source: DWS Investments UK Limited. Data as of 12/31/22. See appendix for the representative index corresponding to each asset class.
Past performance may not be indicative of future returns. Forecasts are based on assumptions, estimates, views and or analyses, which might prove inaccurate or incorrect. Any hypothetical results may have inherent limitations. Among them are the sharp differences which may exist between hypothetical and actual results which may be achieved through investment in a particular product or strategy. Hypothetical results are generally prepared with the benefit of hindsight and typically do not account for financial risk and other factors which may adversely affect actual results.
This publication details the long-term capital market views that underpin the strategic allocations for DWS’s multi-asset portfolios. These estimates are based on 10-year models and should not be compared with the 12-month forecasts published in the DWS CIO View.
Central to this document is our belief that clients should consider a long-term perspective beyond 1-5 years when it comes to constructing investment portfolios. Perhaps, counterintuitively, extending the investment horizon has, in the past, produced less volatile, more precise forecasts, as shown in Figure 18: while risk still matters and there is still a distribution of investment outcomes around any central forecast, this distribution has tended to become narrower when investing for longer investment horizons. One consequence of this is that entry points become less relevant (even though of course by no means irrelevant) for longer investment horizons (because cyclical and tactical drivers are overtaken by fundamental, structural drivers of asset class returns). This is true even at times of extreme valuation: taking one of the biggest previous bubbles (the dot.com boom) as an example, the difference between buying US equities exactly at the peak of the dot.com boom in April 2000 vs. a year later (after valuations had collapsed) only amounts to one percent compounded annually when investing with a 15-year time horizon (as we show in Figure 22 on page 18). However, if an investor had had a shorter horizon of five years, the difference in returns generated from buying at the peak versus one year later was far greater, amounting to roughly six percent per annum. Thus, the longer the holding period for an investment, the stronger the case that its return is primarily driven by the underlying fundamental building blocks.
Looking at rolling one-year price returns of the S&P 500 from 1871 to 2022, a negative two-standard-deviation move equated to a 27 percent decline in prices (Table 5 on page 19). When calculating a negative two-standard-deviation move using rolling 10-year returns over this same time frame, the decline in prices is less than 1 percent per annum. More stable long-run returns can be helpful in establishing more stable strategicasset-allocation targets.
Hence, sceptics may be surprised to learn that the volatility of returns historically has been lower when using long-term horizons, although past performance may not be indicative of future results.
Figure 17: Asset allocation and risk allocation by target volatility
 |
 |
Source: DWS Investments UK Limited. Data as of 12/31/22. For illustrative purposes only. See page 29 for details. See appendix for the representative index corresponding to each asset class.
Figure 18: Distribution of U.S. equities: Historical returns over different holding periods, annualised
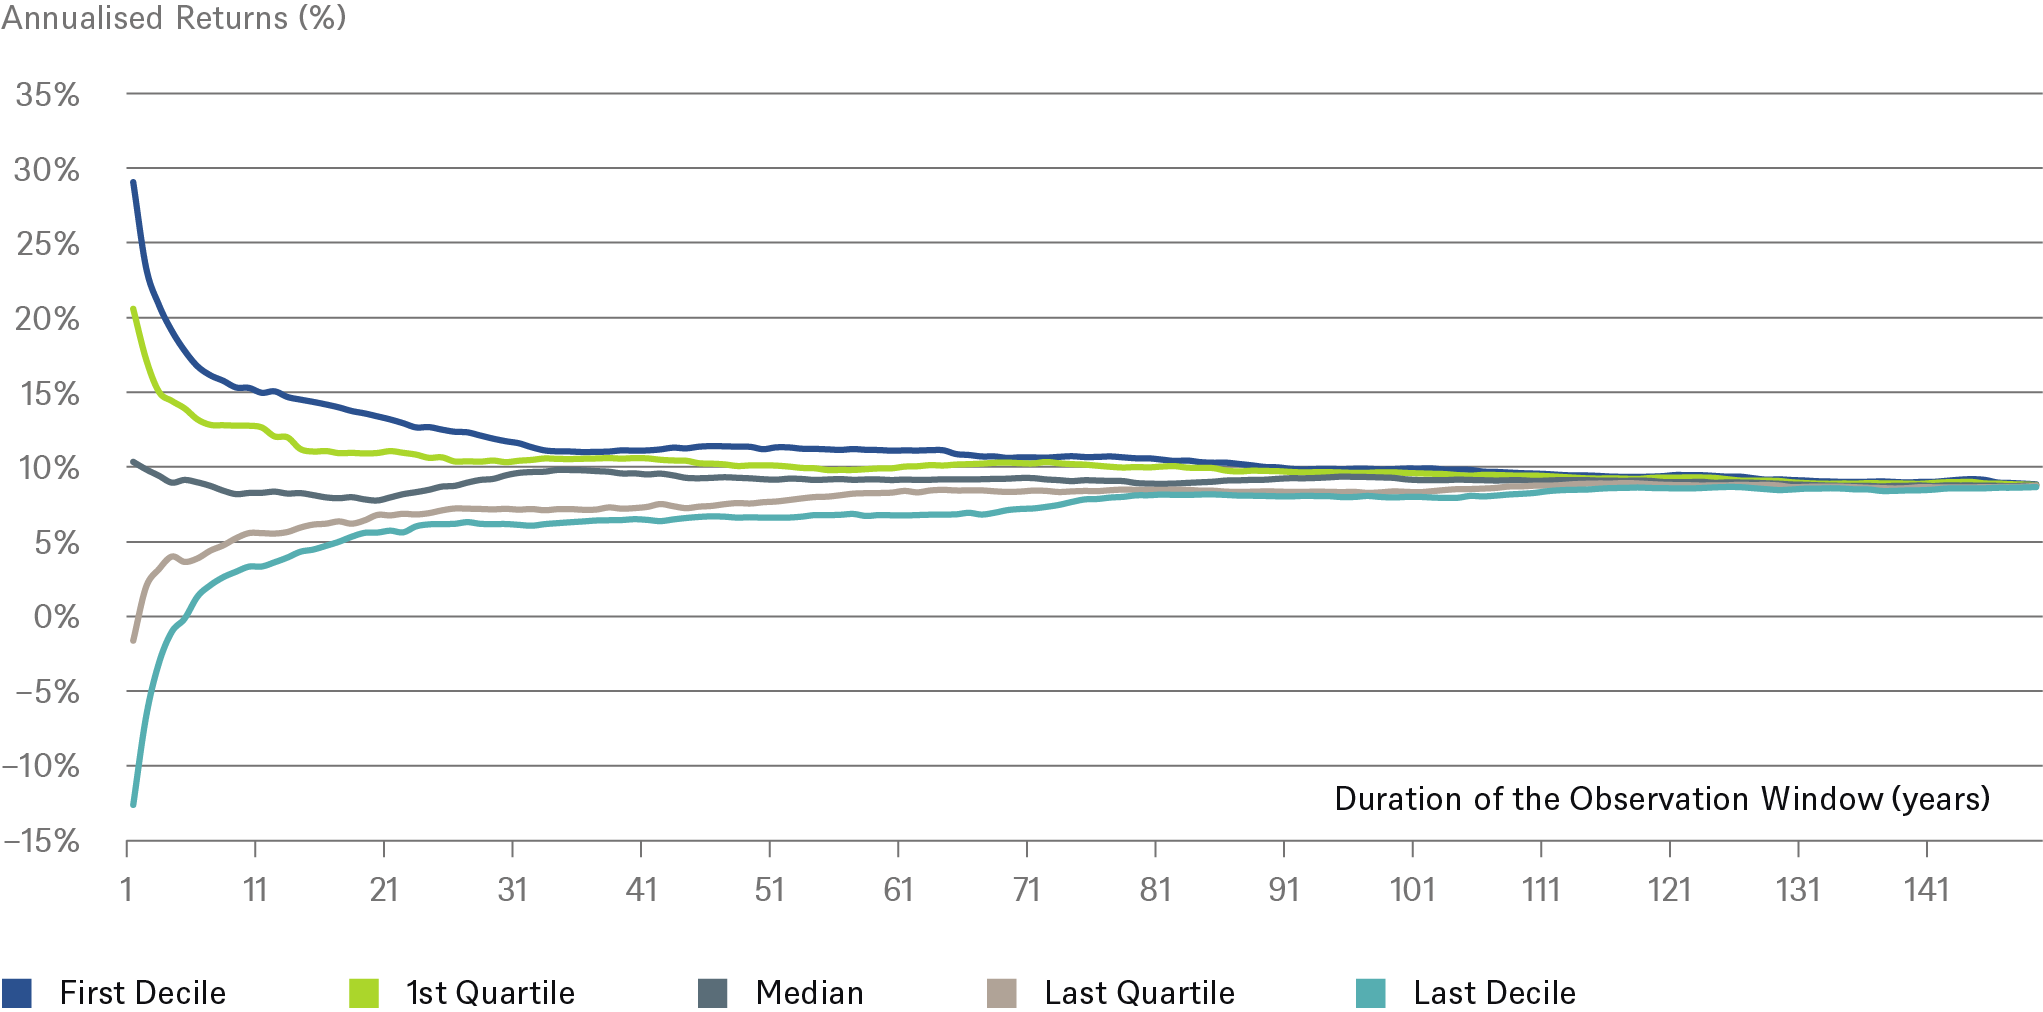
Source: Robert J. Shiller, DWS Investments UK Limited. Data from 1871 to 2022.
Framework
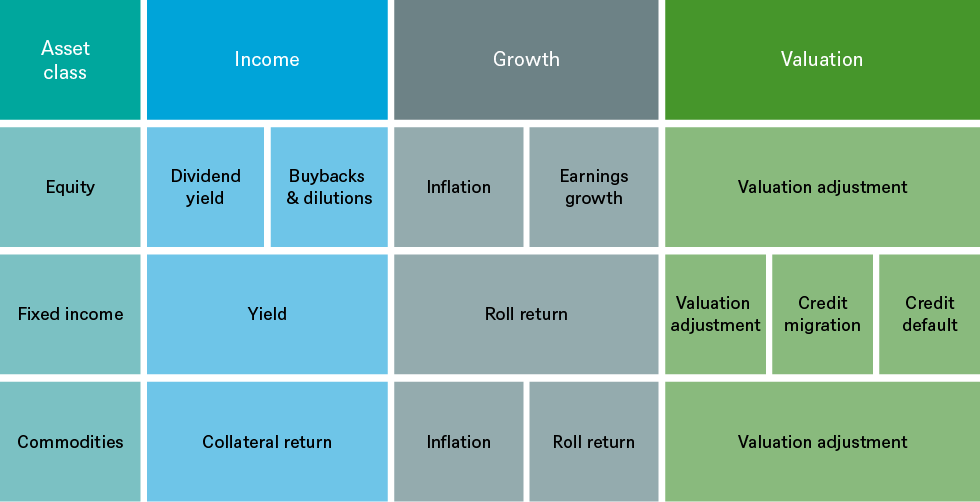
We use the same building-block approach to forecasting returns irrespective of asset class. We believe this approach brings consistency and transparency to our analysis and also may help clients to better understand the constituent sources of forecasted returns.
The Long View framework breaks down returns into three main pillars: income + growth + valuation, each with their own subcomponents. The pillars and components for the traditional asset classes under our coverage (equities, fixed income and commodities) are show in Figure 19.
Meanwhile, alternative asset classes under our coverage (listed real estate, private real estate, real estate debt, listed infrastructure equity and private infrastructure debt) are forecasted using exactly the same approach, sometimes with an added premium to account for specific features, such as liquidity.
Figure 19: Long View for traditional asset classes: Pillar decomposition
Source: DWS Investments UK Limited.
Figure 20: Long View for alternative asset classes: Pillar decomposition
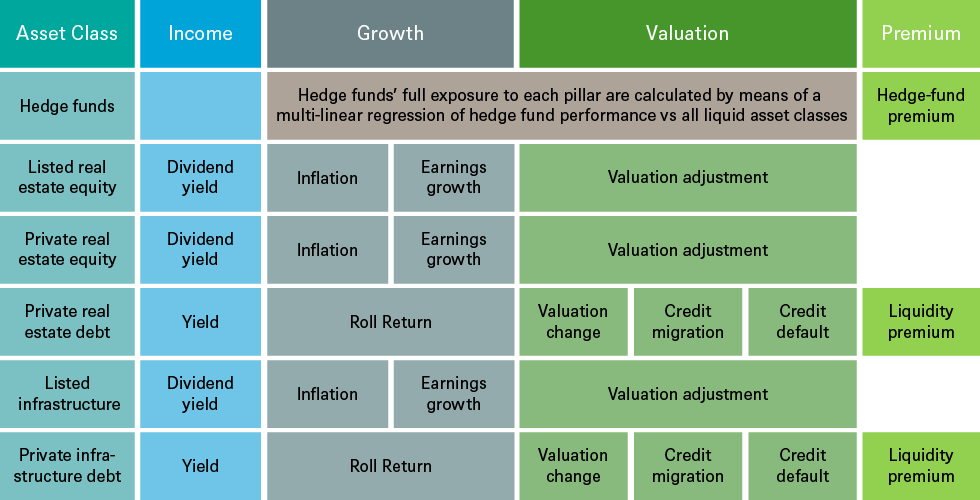
Source: DWS Investments UK Limited.
Return forecasts
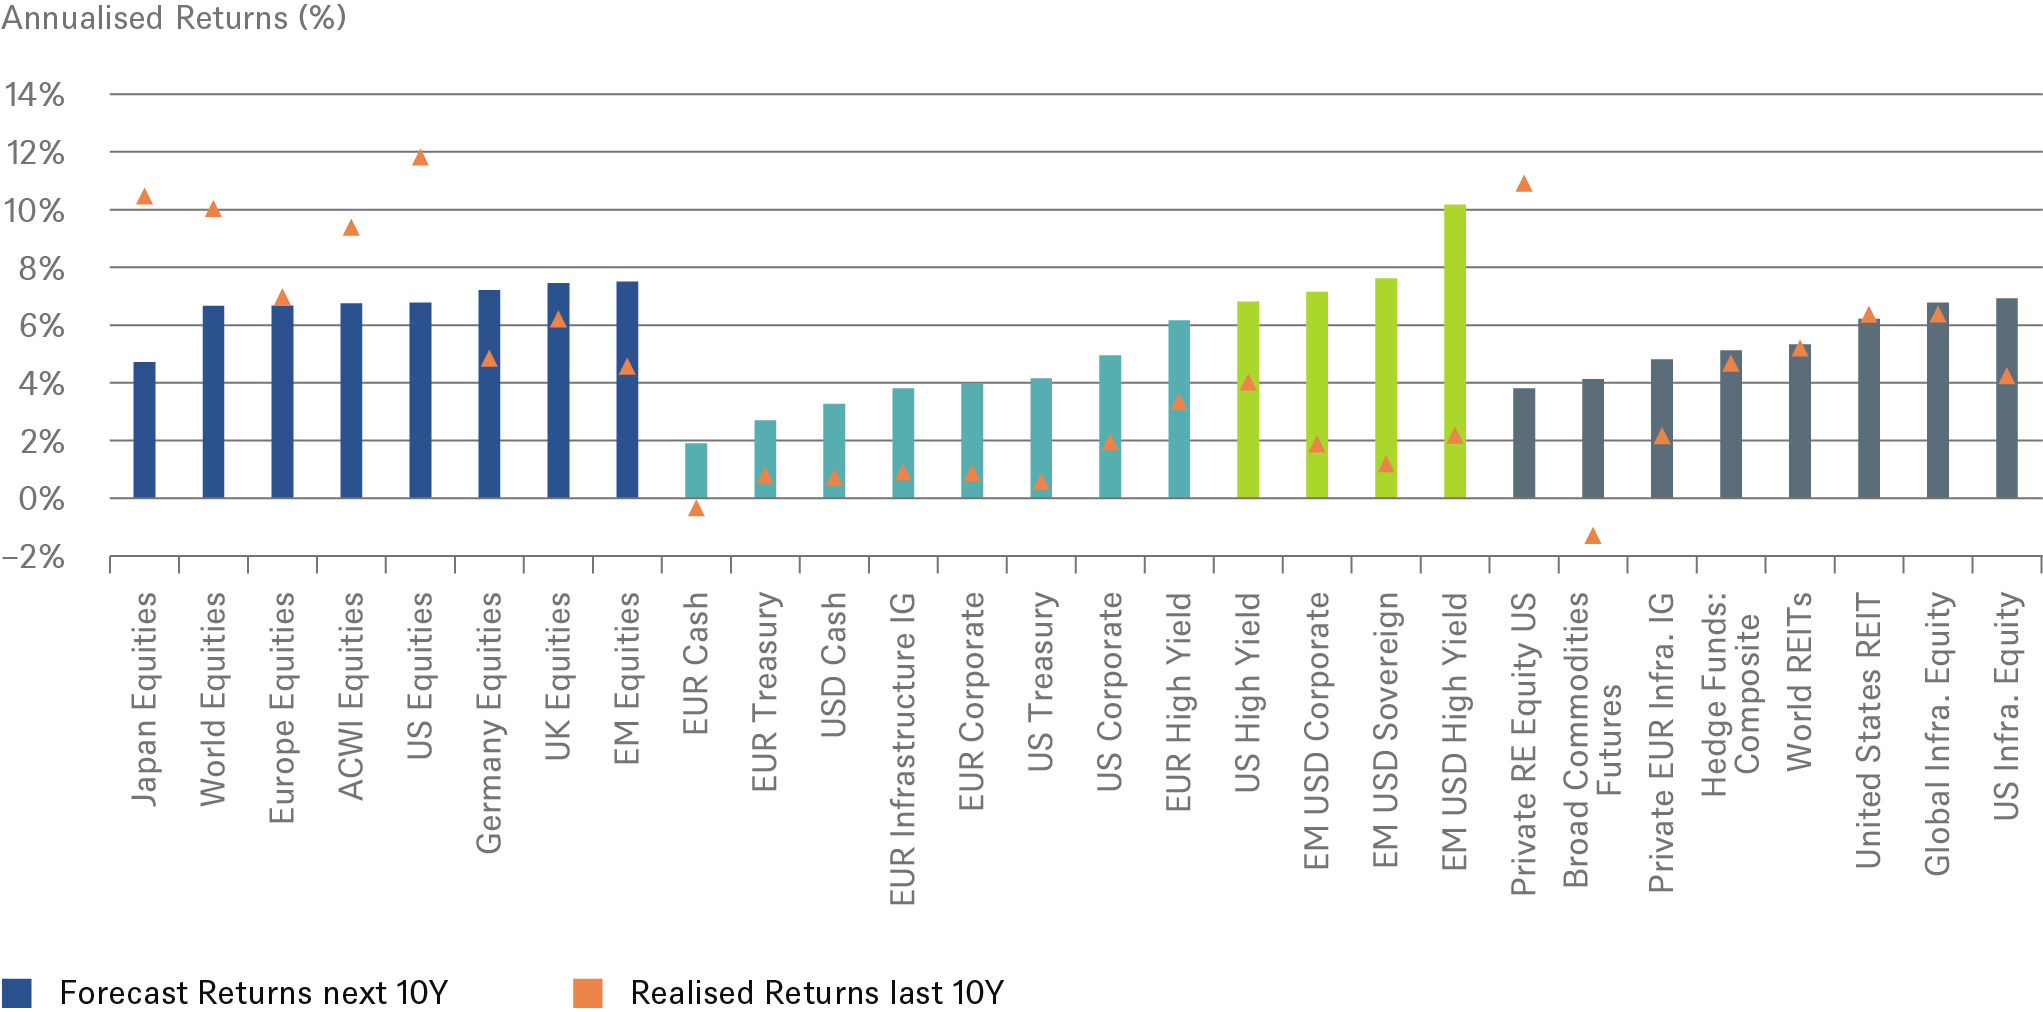
Our Long View forecasts for all asset classes can be seen below. The bars are ranked by ascending forecasted return within each asset class.
In summary, we make the following key observations from the results:
- Return forecasts across equities have significantly increased from last year’s forecasts; in Europe and EMs they are now in line with or modestly above the realized returns over the past decade, whereas in US equities they are still well below the strong realized returns over the past 10 years.
- Across regional equity markets, the emerging markets are expected to offer the highest forecasted returns, but only marginally ahead of some European markets and the US.
- Fixed income return forecasts show the most positive change, both versus the previous year’s forecasts and relative to the previous decade. Both core fixed income and credit offer higher nominal return outlooks, given high current starting yield levels.
- Within credit, (across IG and HY corporates as well as sovereign and corporate EMD), return forecasts are well above previous decade returns. EM USD sovereign and corporate debt in particular are the highest across credit asset classes.
- Alternative asset class return forecasts at in line with to modestly below traditional asset class forecasts. Within alternatives, infrastructure equity has the highest return outlook. Decline in private RE equity forecasts reflect both a methodology change to earnings contribution but more importantly less attractive valuations relative to TIPS yields.
- Commodity future return forecasts are healthier now than the very poor realized returns of the previous decade and could provide useful diversification benefits and potential inflation protection.
Investors should be conscious of the impact of foreign-exchange (forex) risk on base-currency returns and volatilities. Depending on risk appetite and return objectives, investors may want to consider hedging currency risk.
Figure 21: Forecast and realised returns for 10 years, annualised (local currency)
Source: DWS Investments UK Limited. As of 12/31/22. See appendix for the representative index corresponding to each asset class.

